BTC/USD: Bitcoin Briefly Wipes Out All 2025 Gains as Prices Dip Under $93,200
500
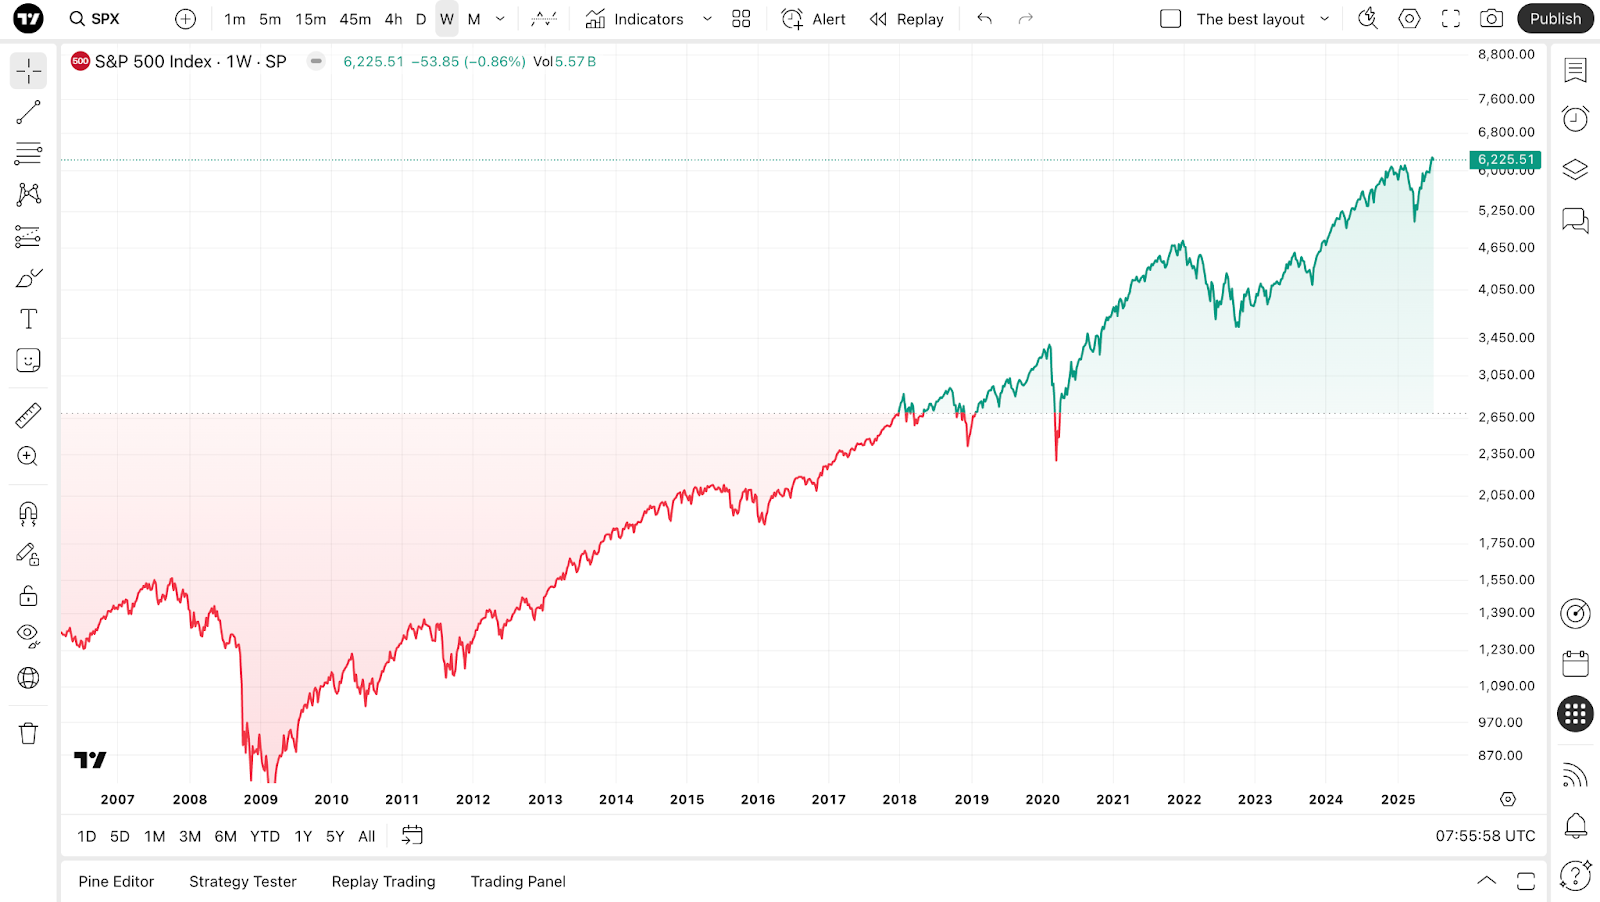
S&P 500
SPX
6,734.10
USD
-0.05%